.png?height=120&name=MicrosoftTeams-image%20(6).png)
Our Diversity & Inclusion reports will enable you to gain deep insights into your organization's diversity and inclusion efforts, empowering you to make informed decisions, track progress, and implement effective strategies.
Diversity and inclusion are fundamental aspects of a thriving and successful organization. Culture Intelligence reports provide valuable insights into an organization's efforts in promoting diversity and inclusion. This article explores key elements of Culture Intelligence reports related to diversity and inclusion, including filtering options, infographics on participation rates by gender, rewards distribution, rewards distribution by month, rewards distribution gender to gender, and rewards distribution by gender and tenure. These insights assist organizations in evaluating their progress and identifying areas for improvement in promoting diversity and inclusion.
Filtering Options:
At the top of the page, there are filter options to adjust the data. These filters include country, organizational unit, division, and a date range (from and to). These options will allow you to narrow down the data and focus on specific segments and timeframes.
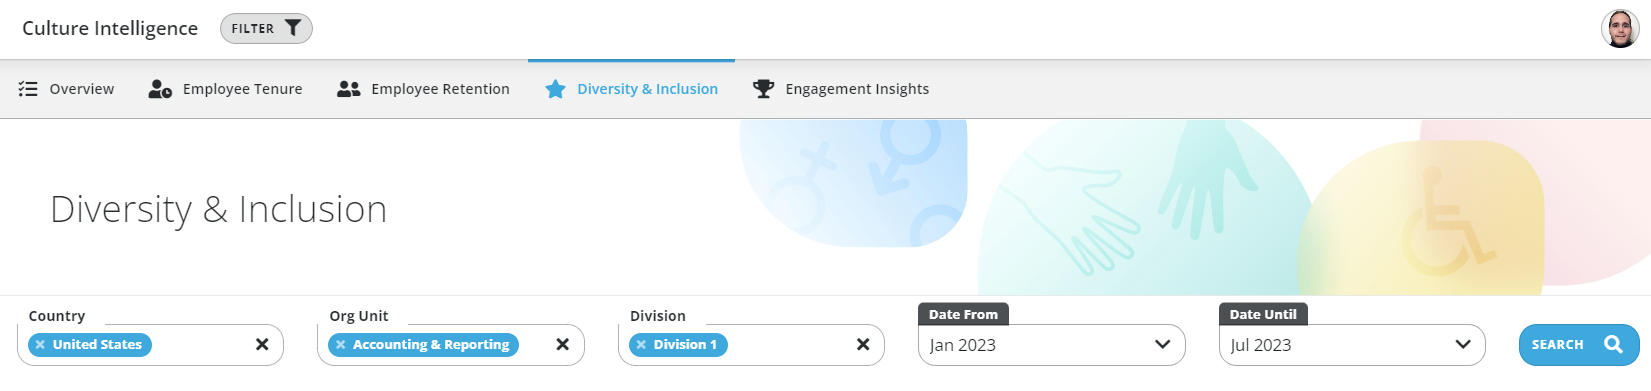
Image: Diversity and Inclusion - Filters
Infographic: Participation Rates by Gender
The first infographic in the KPI report examines participation rates by gender. It allows selection between male and female employees and further categorizes them by employee/manager status. Additionally, users can select engaged and unengaged employees within each category. This infographic provides insights into the level of representation and engagement of different genders within the organization.

Image: Diversity and Inclusion - Participation Rates by Gender
Infographic: Rewards Distribution
The second infographic focuses on rewards distribution by gender. It assesses the representation of different genders in award distribution across the organization. Additionally, it provides a breakdown of awards given out by gender, analyzing gender equality in award recipients. This infographic helps organizations understand if there is equal representation and recognition for both male and female employees.
 Image: Diversity and Inclusion - Rewards Distribution
Infographic: Rewards Distribution by Month
The third infographic presents the distribution of rewards by gender on a monthly basis within the last 12 months. This chart highlights the ongoing efforts to promote gender inclusion and tracks progress towards achieving equitable rewards distribution across different months. Users can select the breakdown by male, female, and other genders to gain insights into the inclusivity of reward distribution efforts.
 Image: Diversity and Inclusion - Rewards Distribution by Month
Infographic: Rewards Distribution Gender to Gender
The fourth infographic utilizes a matrix view to analyze rewards allocation based on gender. The main goal is to have a visual representations if there is unequal distribution among genders.
The chart visually highlights different rewards received by gender using three distinct colors.
Red indicates rewards allocated within the same gender, reflecting a gender-specific distribution.
Orange represents a neutral distribution where gender is not a determining factor.
Green signifies a mixed distribution, indicating rewards allocated across different genders.
If there is no gender data available, the area will be greyed out.
This infographic helps identify any gender-based biases or imbalances in rewards allocation.

Image: Diversity and Inclusion - Rewards Distribution Gender to Gender
Infographic: Rewards Distribution by Gender and Tenure
The final infographic presents a matrix view showcasing the distribution of rewards based on both gender and tenure within the organization. It allows for a quick evaluation of whether men and women receive equitable rewards based on their contributions and performance. By analyzing rewards distribution by tenure, organizations can assess whether employees with varying lengths of service receive proportional recognition and rewards. This analysis helps determine if long-serving employees are appropriately acknowledged and incentivized and if new employees are provided with fair opportunities for recognition and rewards.

Image: Diversity and Inclusion - Rewards Distribution by Gender and Tenure
Culture Intelligence reports on diversity and inclusion provide organizations with essential insights into their efforts to promote gender equality and inclusion. By utilizing filtering options and analyzing infographics on participation rates, rewards distribution, rewards distribution by month, rewards distribution gender to gender, and rewards distribution by gender and tenure, organizations can identify areas for improvement and develop strategies to enhance diversity and inclusion initiatives. These insights enable organizations to create a more inclusive and equitable workplace environment, leading to improved employee engagement, retention, and overall organizational success.
If this article left your questions unanswered, please submit a Support Form, and we can clarify this topic.