Visual representation of widely used corporate analytics
In this article:
- Recognition dashboard
- Feedback dashboard
- Health & wellness dashboard
- Short video as step-by-step guide
The dashboard provides a visual representation of widely used corporate analytics. It can be the most efficient way for tracking the activity of users and analyze engagement over time.
Login to JobPts -> Admin Center -> Reports -> Dashboard
Recognition dashboard - shows all activities that employees have in a selected period of time. Available charts here are:
- Employee Activities Timeline,
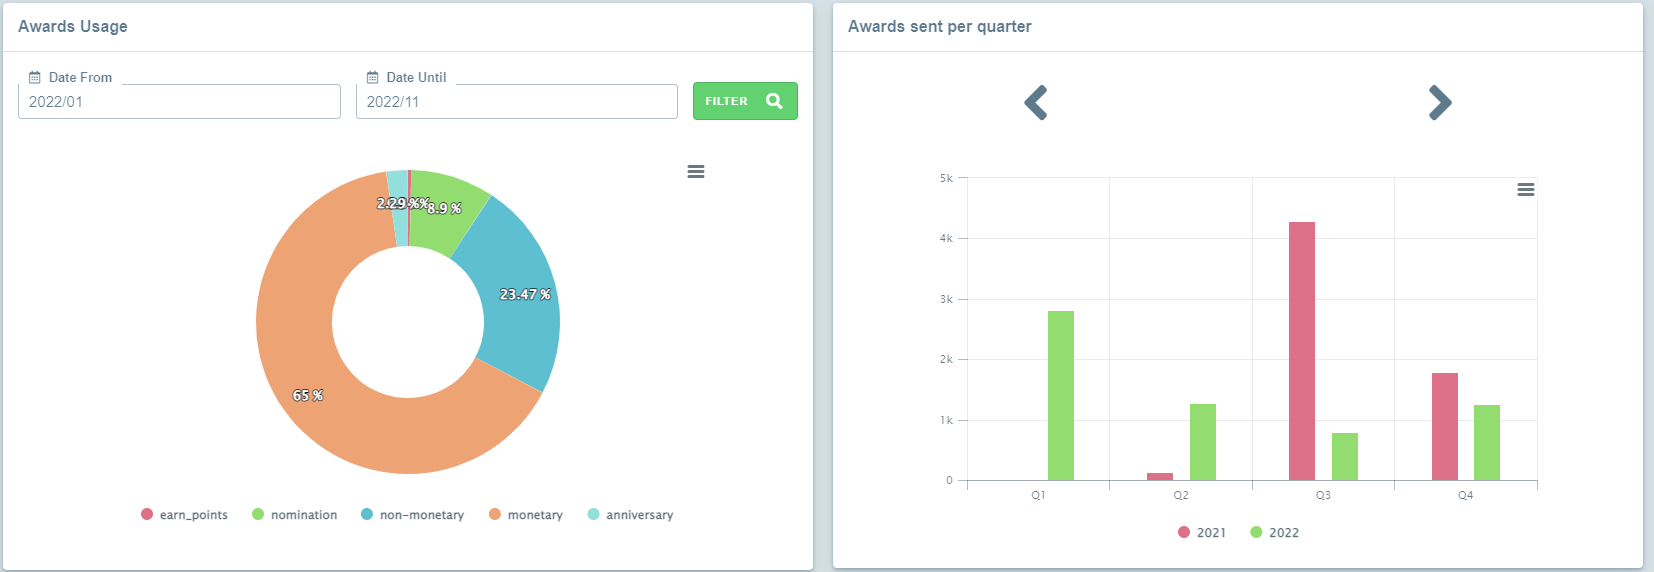
- Awards Usage,
- Awards sent per quarter,
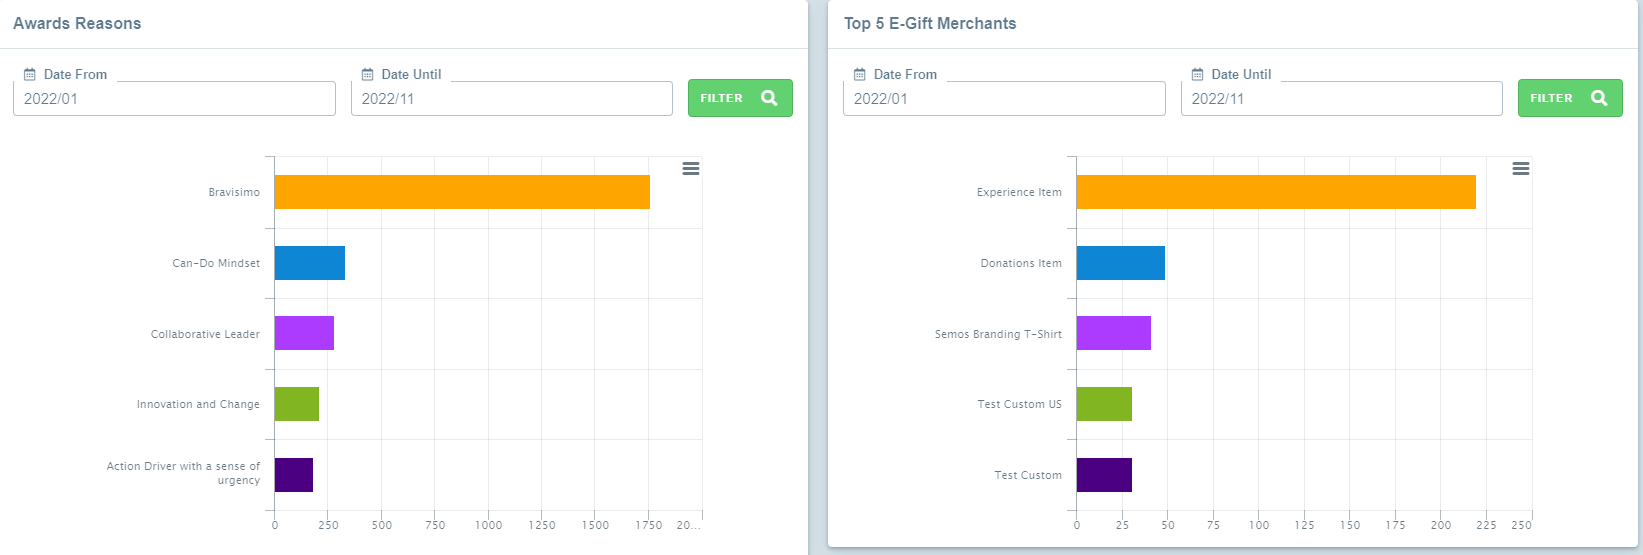
- Awards Reasons,
- Top 5 E-Gift Merchants and
- Program Drilldown per Country

Image: JobPts Dashboard Report - Recognition
The Recognition report can be filtered by:
- Country - select the country for which you want the data to be filtered
- Business Unit - select the Business Unit for which you want the data to be filtered
- Company Code - select the Company Code for which you want the data to be filtered
- Department - select the Department for which you want the data to be filtered
*All filters are available for multiple selection.
 Image: Employee Activities Timeline

Image: Awards Usage and Awards sent per quarter

Image: Awards Reason and Top 5 E-Gift Merchants
 Image: Programs Sender in Points
Feedback dashboard - shows all activities that employees have in the selected period of time for using feedback functionality. Available charts here are:
- Feedback Activities Timeline,
- Feedback Types Usage,
- Sent feedback per quarter,
- Sent Behaviors,
- Requested Behaviors
The Feedback report can be filtered by:
- Country - select the country for which you want the data to be filtered
- Business Unit - select the Business Unit for which you want the data to be filtered
- Company Code - select the Company Code for which you want the data to be filtered
- Department - select the Department for which you want the data to be filtered
 Image: JobPts Dashboard Report - Feedback
 Image: Feedback Activities Timeline
 Image: Feedback Types Usage and Sent feedback per quarter
 Image: Sent Behaviors and Requested Behaviors
Health dashboard - shows the corporate health and wellness activities. It is represented by two charts:
- Corporate achievements
- Achievements by measure type, showing the achieved Health goals by using Health functionality.

Image: JobPts Dashboard Report - Health
 Image: JobPts Dashboard Report - Corporate Achievements
 Image: JobPts Dashboard Report - Achievements by measure type
Please review our comprehensive step by step video guide:

If this article left your questions unanswered, please submit a Support Form, and we can clarify this topic.
.png?height=120&name=MicrosoftTeams-image%20(6).png)