.png?height=120&name=MicrosoftTeams-image%20(6).png)
Our Employee Tenure reports offer insights to analyze trends and improve retention by identifying factors influencing employee longevity and maximizing the value of experienced employees.
Employee tenure is a crucial factor to consider when assessing an organization's performance and overall workforce dynamics. By analyzing these reports related to employee tenure, organizations can gain valuable insights into the distribution of talent, identify top performers, and address unrecognized potential. This article provides an overview of key elements related to employee tenure, including filtering options, infographics for recognizing top performers and addressing unrecognized talent, and an employee recognition heat map by organizational unit and tenure.
Filtering Options
At the top of the page, there are filter options to adjust the data. These filters include country, organizational unit, division, and a date range (from and to). These options will allow you to narrow down the data and focus on specific segments and timeframes.
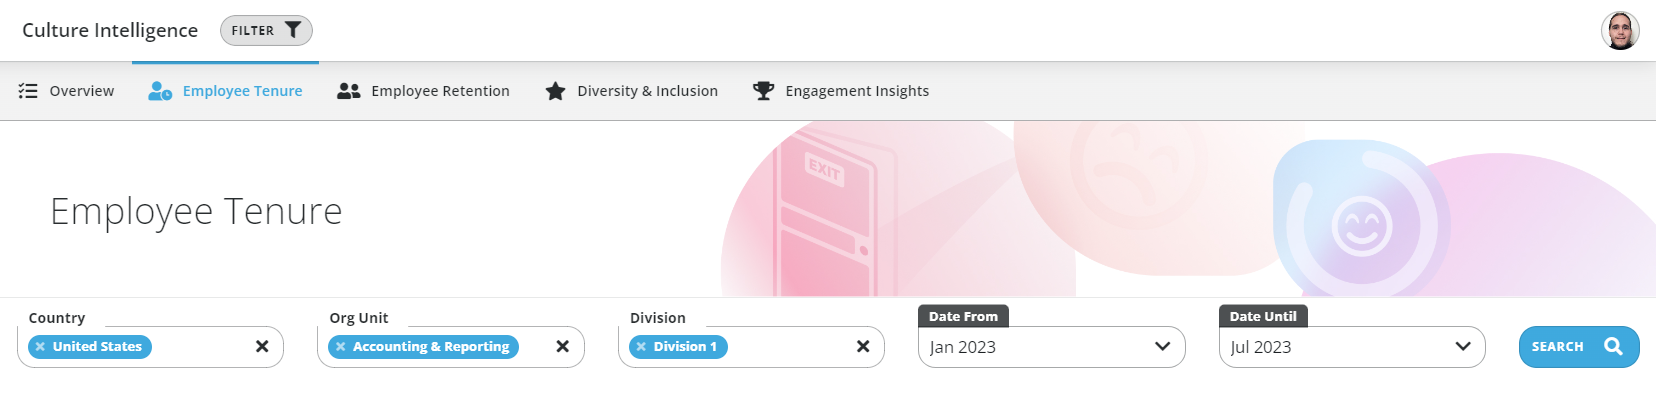
Image: Employee Tenure - Filters
Infographic: Identifying Top 10% Performers and Addressing Unrecognized Talent
The first infographic in the KPI report focuses on identifying top performers and addressing unrecognized talent. It is divided into two parts: most recognized and least recognized. Each part is further categorized based on employee tenure:
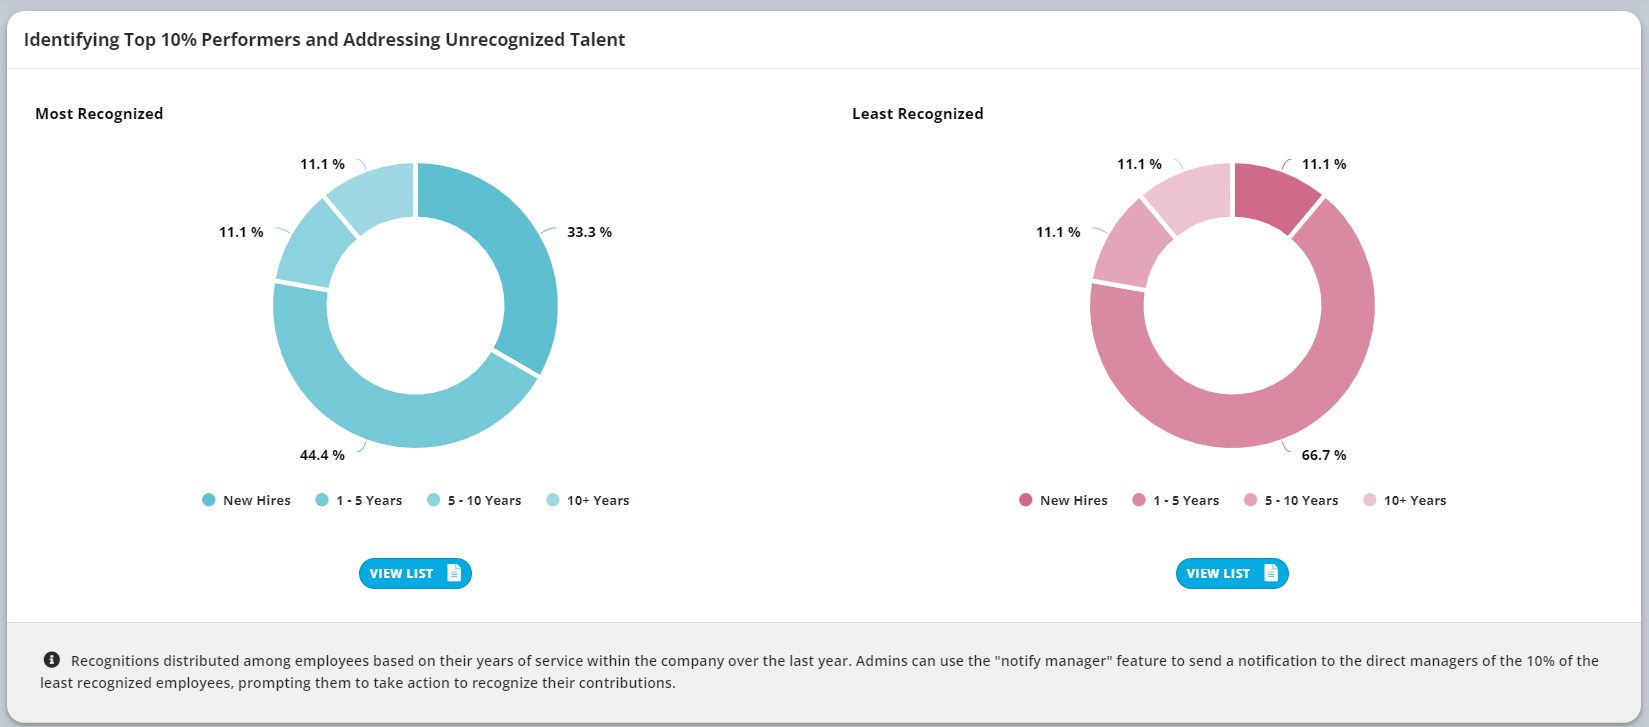
Image: Employee Tenure - Identifying Top 10% Performers and Addressing Unrecognized Talent
Most Recognized:
- New Hires: This category comprises employees who have recently joined the organization.
- 1-5 Years: This category includes employees with a tenure between one and five years.
- 5-10 Years: Employees who have been with the organization for five to ten years fall into this category.
- 10+ Years: This category includes employees with ten or more years of tenure.
Least Recognized:
- New Hires: This category represents new employees who are not receiving sufficient recognition.
- 1-5 Years: Employees with a tenure between one and five years who are not adequately recognized.
- 5-10 Years: Employees with a tenure of five to ten years who require more recognition.
- 10+ Years: This category represents employees with over ten years of tenure who are not receiving appropriate recognition.
When you open the users who are least recognized by selecting the View List option, the following pop-up window will appear giving you the option to notify all the managers or specific managers regarding their employee activity.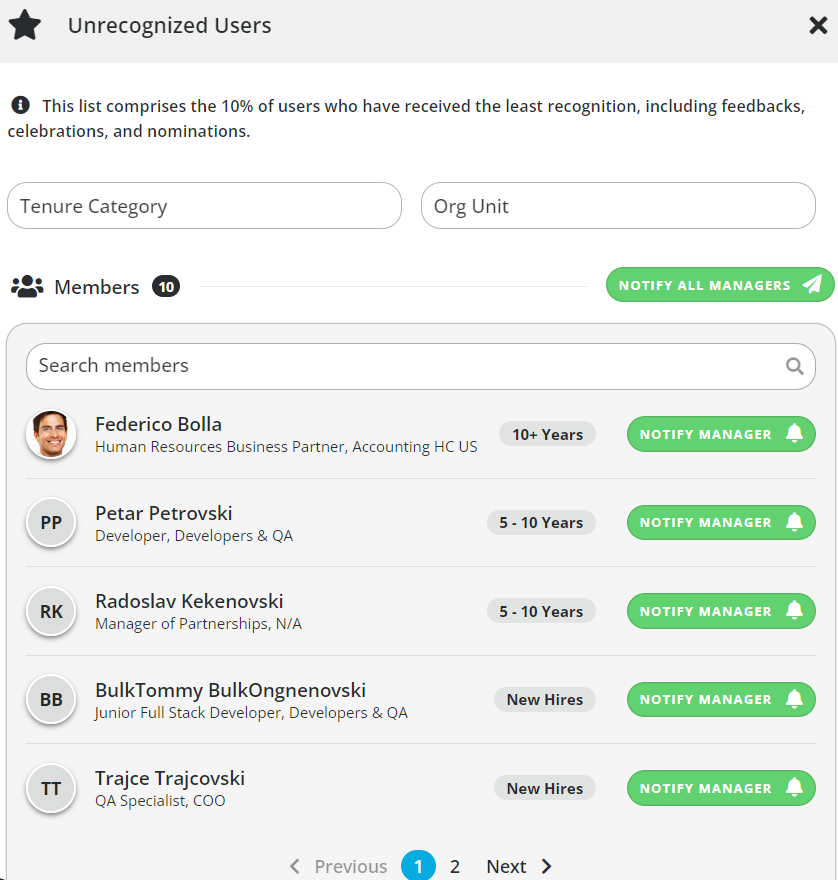 Image: Employee Tenure - Unrecognized Users
Infographic: Employee Recognition Heat Map by Organizational Unit and Tenure
The second infographic in the KPI report focuses on an employee recognition heat map. The left side of the infographic displays all organizational units within the company, while the right side presents employees categorized by tenure:
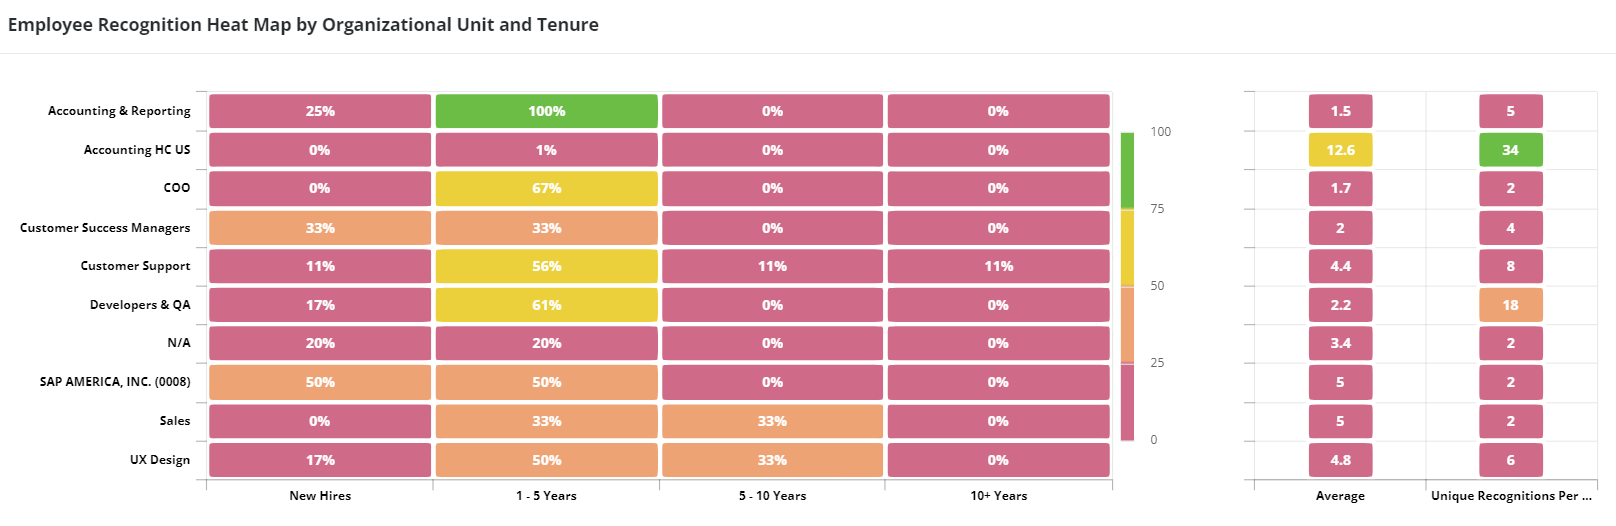
Image: Employee Tenure - Employee Recognition Heat Map by Organizational Unit and Tenure
New Hires: Employees who have recently joined the organization.
1-5 Years: Employees with a tenure between one and five years.
5-10 Years: Employees who have been with the organization for five to ten years.
10+ Years: Employees with ten or more years of tenure.
By hovering over each category, the infographic displays the percentage of recognition received by employees in that specific group. This heat map allows organizations to visualize the distribution of employee recognition across different organizational units and tenure categories, enabling them to identify areas where recognition may be lacking or thriving.
Our employee tenure reports provide organizations with valuable insights into their workforce dynamics, allowing them to identify top performers and address unrecognized talent. By utilizing filtering options, organizations can customize the data they analyze to align with their specific needs. The infographics included in these reports, such as identifying top performers and recognizing employee tenure through heat maps, offer visual representations of important data points, making it easier for organizations to make informed decisions and take appropriate actions to enhance employee engagement and overall performance.
If this article left your questions unanswered, please submit a Support Form, and we can clarify this topic.